Spot Price “Guess Who” Application
YouDo are specialists in taking data sets and gaining actionable insights using data science techniques. A prime example of this is a demonstration that YouDo did at the 2017 Energy Trader Forum in Wellington, where we presented our “Guess Who” application.
The “Guess Who” application was designed to look at anonymized offers on the energy spot market and determine who the generator is by looking at the grid exit points (GXP), price and megawatt (MW) offering.
To better frame this problem, it is important to remember that the spot market is complex and can be influenced by several factors, including;
- Weather and hydrology
- Outages and line constraints
- Contracts
- Generation capabilities
- Reserve market
- Competitor positions
- And many more
Before the gate closure, each trader must build up a picture of the upcoming events and react accordingly. The faster that you can build up the picture of the future, the more time a trader has, to make a decision.
Now, a seasoned trader can make predictions on which generators are offering capacity and at what price, based on their knowledge of the market and each competitor in the offer stack.
But how about a junior trader? How can you arm them with the knowledge and confidence levels to make better, faster decisions? Can you reduce the time pressure on experienced traders by giving them automated predictions?
To approach this problem, YouDo used publicly available historical offer data (generators’ offers and cleared offers) and final price data from 2015 through to the end of 2016 to train and verify our prediction model. After trialling and testing a range of models, we settled on a Heuristic approach using Clustering and Integer programming to form our prediction model.
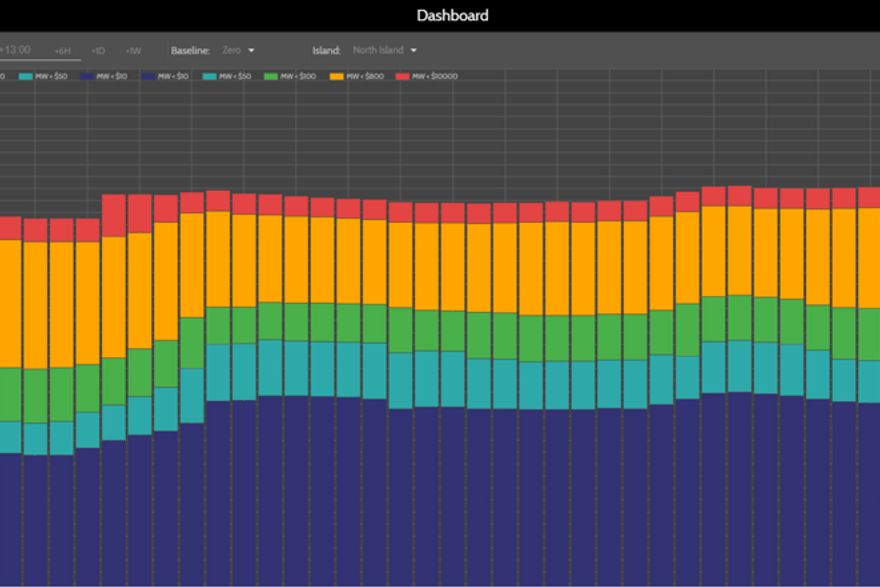
Using the output from the model we created a simple, interactive user interface (UI), designed to sit on a trader’s screen. Using the UI, we allowed a trader to see the offer stack (Fig 1), drill down on a single trading period (Fig 2) and look at the predicted trader and the predictions confidence level.


Comparing the models’ prediction to the actual data (Fig 3) we discovered the following;
- From our limited scope we accurately predicted the trader behind the total megawatt offered (81% accuracy for the North Island, 91% accuracy for the South Island).
- Weekends are difficult to predict – this is because there are less days to train the model on.
- Tuesday is the most difficult day to predict, with Monday being close behind. This is due to strategy meetings happening on Mondays and new trading strategies being put into place on the Tuesday.
- Thursday and Friday were the easiest days to predict.

The following project was an example problem given to YouDo by a client who wanted to see what is possible. They were surprised and impressed by the result and the speed in which we were able to gain actionable insights from otherwise ‘useless’ data.
Got a dataset and questions you want answered? Why not talk to the YouDo Crew today to see what value we can add to your organisation.
Interested in a live demo of the “Guess Who” application? Book a demo!


